Blog Stats by Numbers
Processing Data, New Scores And Schedule Pages, And The Story Of Stats By Numbers
Written By Bobby Oster
Processing Data
I said that I’d give an update when I was about a week into the process of getting the old data launched back on the site. We’ve finished compiling all of the data necessary to run our game simulators and crank through all the statistics. It turns out that there were about 1.64 million plays and 90,524 player box score line entries over the course of the last three seasons. Right now, we’re in the middle of categorizing and processing data on these plays so that we can give you the advanced box scores and play by plays that were on the site before.
New Scores And Schedule Pages
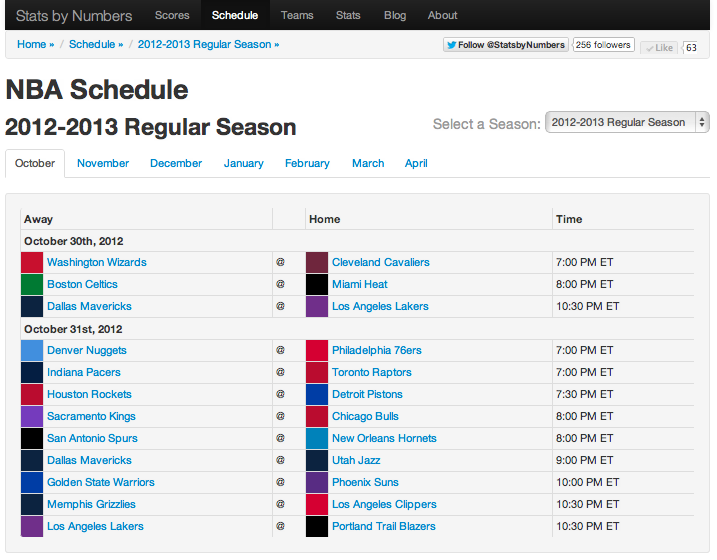
In the meantime, the site has been updated with the new scores page:
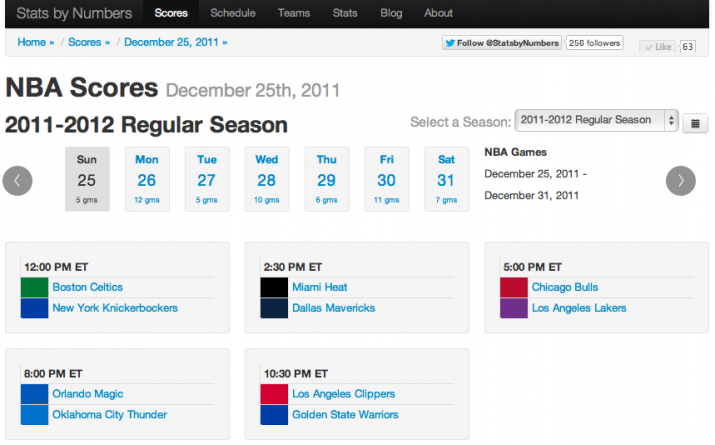
This is a huge improvement over the previous incarnation of the page, where you could only move to and from the previous days games. For a frame of reference, here is a screenshot of the old interface:

The old scores page that was pretty sparse and made it difficult to get to a specific date.
Finally, we’ve separated the scores page from the schedule in order to create a few ways to get at the information you’re looking to find. The schedule will contain all the game for a season, sortable by month. The scores page will contain the latest box scores and play by plays that we have on the site after we finish processing data for that day.
Origins Of Stats By Numbers
While we’re still processing data for the start of the season, I thought I’d take the time to share more about the origins of Stats by Numbers. The site started with my own desire to access statistics that weren’t readily available. It was the 2006-2007 season and Lakers were being crushed by the Suns in the 1st round playoff series. The consensus among the media and fans was that Lamar wasn’t the Robin that Kobe’s Batman needed. I remember thinking this was totally off base as their two-man statistics were great in the 2005-2006 and 2006-2007 series. LO averaged 19+ PTS, 12 REB, 3.5 AST, and 1+ BLK per game over the course of the playoffs. Not that bad for a second option; it was the rest of the team that was lacking. In order to make my point, I remember coming up with a crazy Excel spreadsheet that had all the game performances and splits – so I could bolster my case that Lamar wasn’t the cause of the problem. I spent a great deal of time processing data and getting my numbers put together, but I still didn’t have them organized in a way that I could really do anything with them.
At the time, I thought to myself that it was silly that there wasn’t a better way for me to access the statistics that I wanted; this was the genesis of Stats by Numbers. I started tracking game data in a database instead of a spreadsheet and that is when things changed. I realized that there was a wealth of basketball statistics available that weren’t being processed. The data was right there, but no one was doing anything with it. One of my biggest pet peeves is the possessions equation:
0.5 * ((Tm FGA + 0.4 * Tm FTA – 1.07 * (Tm ORB / (Tm ORB + Opp DRB)) * (Tm FGA – Tm FG) + Tm TOV) + (Opp FGA + 0.4 * Opp FTA – 1.07 * (Opp ORB / (Opp ORB + Tm DRB)) * (Opp FGA – Opp FG) + Opp TOV))
Look at all that nonsense. Really!? The number of possessions that a team has each game is a very calculable thing – you just count how many possessions each team has based on the play by play. The Possessions statistic has been available since the 1970s and I think that is part of the reason that they use an estimate; back then, you couldn’t exactly parse the play by play to find out the real number of possessions. With the amount of information and processing power available today, there is no reason to estimate a statistic that you can calculate and know with certainty.
The goal of Stats by Numbers is to provide a new set of raw statistics that can be used to derive a better understanding of basketball. I hope that by providing the stats and splits I myself was looking for, I can provide that same information to others who want to use it. By creating a set of new stats like Time of Possession and tracking the actual number of Possessions, you can also come up with interesting new derived stats like Average Time Per Possession. There is one somewhat big – not so new – idea that I have for the site for this season. I’m keeping it under wraps until we get closer to the start of the season, but rest assured it will be a new take on a way to measure performance. That’s all for now…back to processing data for the 1.64 million plays.

